Unit 01 · lesson
Source → Build → `_site` → Server → Browser
Source → Build → _site → Server → Browser
You have already used the pipeline.
Now make it explicit enough that you can troubleshoot it.
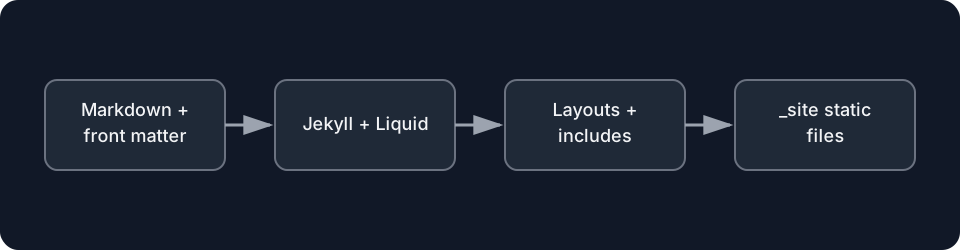
Diagrams open at a readable shape-aware scale. Zoom or expand when you need more detail.
The five-layer trace
1. SOURCE
   index.html, Markdown, config, templates, assets
        ↓
2. JEKYLL BUILD
   reads + processes + copies
        ↓
3. DESTINATION
   _site/
        ↓
4. SERVER / DEPLOYMENT
   makes built files reachable
        ↓
5. BROWSER
   requests and renders them
Every arrow is a boundary where evidence can change.
Guided diagnosis
Symptom A
You edited index.html, but the browser still shows the old sentence.
Possible evidence path:
- Confirm the source file contains the new sentence.
- Confirm Jekyll rebuilt after the edit.
- Inspect
_site/index.html. - Confirm the server is serving the expected project/destination.
- Refresh or bypass stale browser cache if appropriate.
The order matters.
If _site/index.html still contains the old sentence, debugging browser CSS is a waste of time.
Symptom B
_site/index.html is correct, but the browser cannot connect.
Now the source and build layers have evidence in their favor.
Move your attention toward the server/address layer.
Symptom C
The browser loads, but a stylesheet is missing.
That could involve:
- an incorrect source path;
- the asset not being copied/processed;
- an incorrect generated URL;
- the browser requesting a path that does not exist.
Again: trace.
Build a diagnostic table
Create:
| Layer | Evidence I can inspect |
|---|---|
| Source | editor contents, file tree |
| Build | terminal output, errors, timestamps |
| Destination | _site files and contents |
| Server | reported address/port, request response |
| Browser | rendered page, requested resource path |
Add one concrete example from your own project in every row.
Why _site matters
Beginners often ignore _site because "that's generated stuff."
Exactly.
Generated output is one of your best debugging witnesses.
It tells you what Jekyll actually produced, which may be different from what you thought the source meant.
Later, when layouts, Liquid, collections, and environments become involved, inspecting generated output becomes even more useful.
Build a visual trace
Draw or diagram your current project using these labels:
index.html
Gemfile
Jekyll
_site/index.html
local server
browser
Add arrows and label each arrow with a verb:
reads
builds
writes
serves
requests
renders
A diagram with unlabeled arrows is decoration.
A diagram with responsibilities can be tested.
Checkpoint
Choose one failure from this list:
- source not saved;
- build error;
- wrong destination file;
- server not running;
- wrong browser URL.
Write:
Failure:
What still works:
What fails:
First evidence I would inspect:
Why that evidence narrows the problem:
If your answer begins and ends with "restart everything," redo it.