Week 05 · overview
Week 5: Google Sheets and Working With Data
A spreadsheet can calculate perfectly and still support a bad conclusion. This week separates cells, formulas, charts, and evidence so that a correct number does not automatically become a trustworthy claim.
The question
When does a spreadsheet become evidence instead of a pile of cells?
What you will understand
A spreadsheet models records and fields. Formulas are instructions, charts are arguments about data, and misleading scales or missing units can distort a correct calculation.
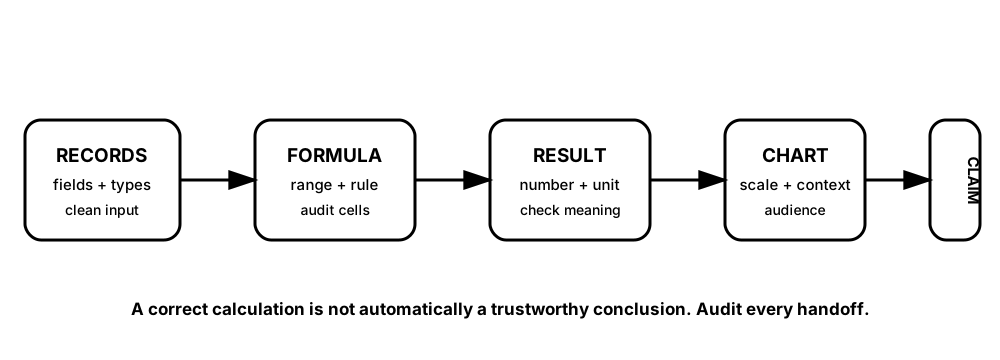
Diagrams open at a readable shape-aware scale. Zoom or expand when you need more detail.
Every arrow in the pipeline is an audit point. A wrong range, missing unit, distorted chart, or oversized conclusion can break the evidence chain even when Sheets returns a number.
What you will do
Classify data types, trace formulas, sort and filter records, critique chart choices, complete the DigitalLearn Google Sheets activity, and analyze a synthetic device dataset.
What you will produce
Student Technology Data Report with cleaned data, calculations, a chart, one defensible observation, and one limitation.
Source activity
DigitalLearn Google Sheets. Robotnix adds the synthetic dataset, evidence claims, and misleading-chart comparison.
Key vocabulary
record, field, data type, formula, function, relative reference, filter, chart, limitation.
Pacing
Five lessons at approximately 42 minutes each.
How this week connects
Sheets turns the course from document production toward data reasoning and prepares for Forms response analysis.